Beyond Australia and New Zealand lies a vast, often overlooked Oceania. These diverse island nations share unique political landscapes, shifting populations, and a front-row seat to the climate crisis. Let's explore what divides them, what unites them, and the monumental challenge ahead.
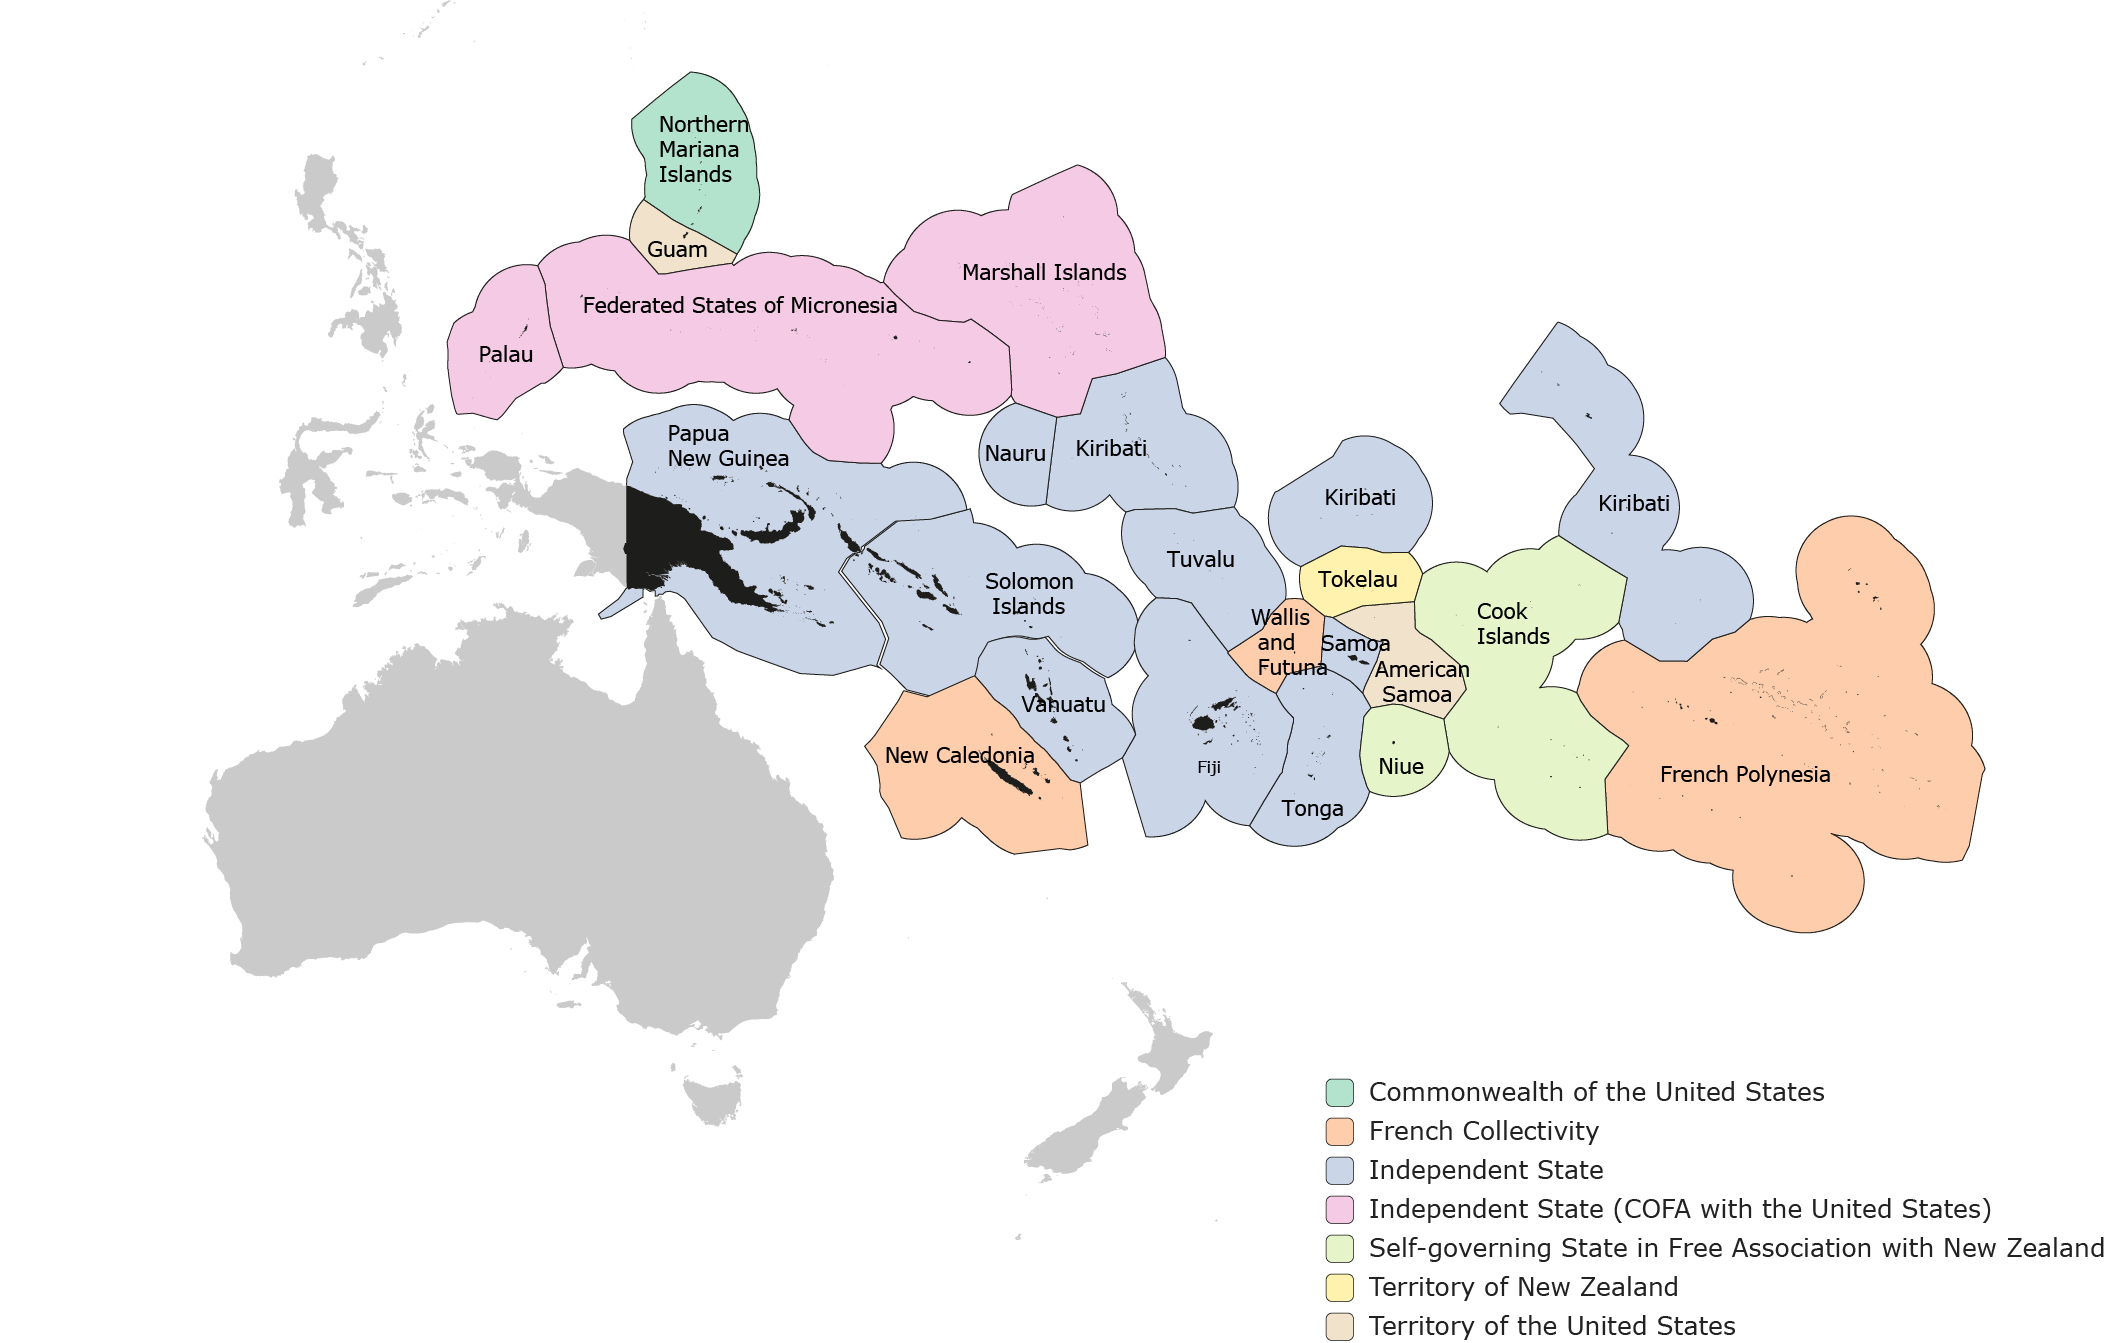
Oceania is massive. A flight from Palau in the west to French Polynesia in the east spans over 8,700 kilometers. At standard cruising speeds, that trip takes roughly ten hours, equivalent to crossing continental Australia from west to east twice. The geography varies greatly: some nations consist of large, compact islands, others are made up of widely scattered islands, while some form vast, sprawling archipelagos. This geography directly shapes their cultures and economies.
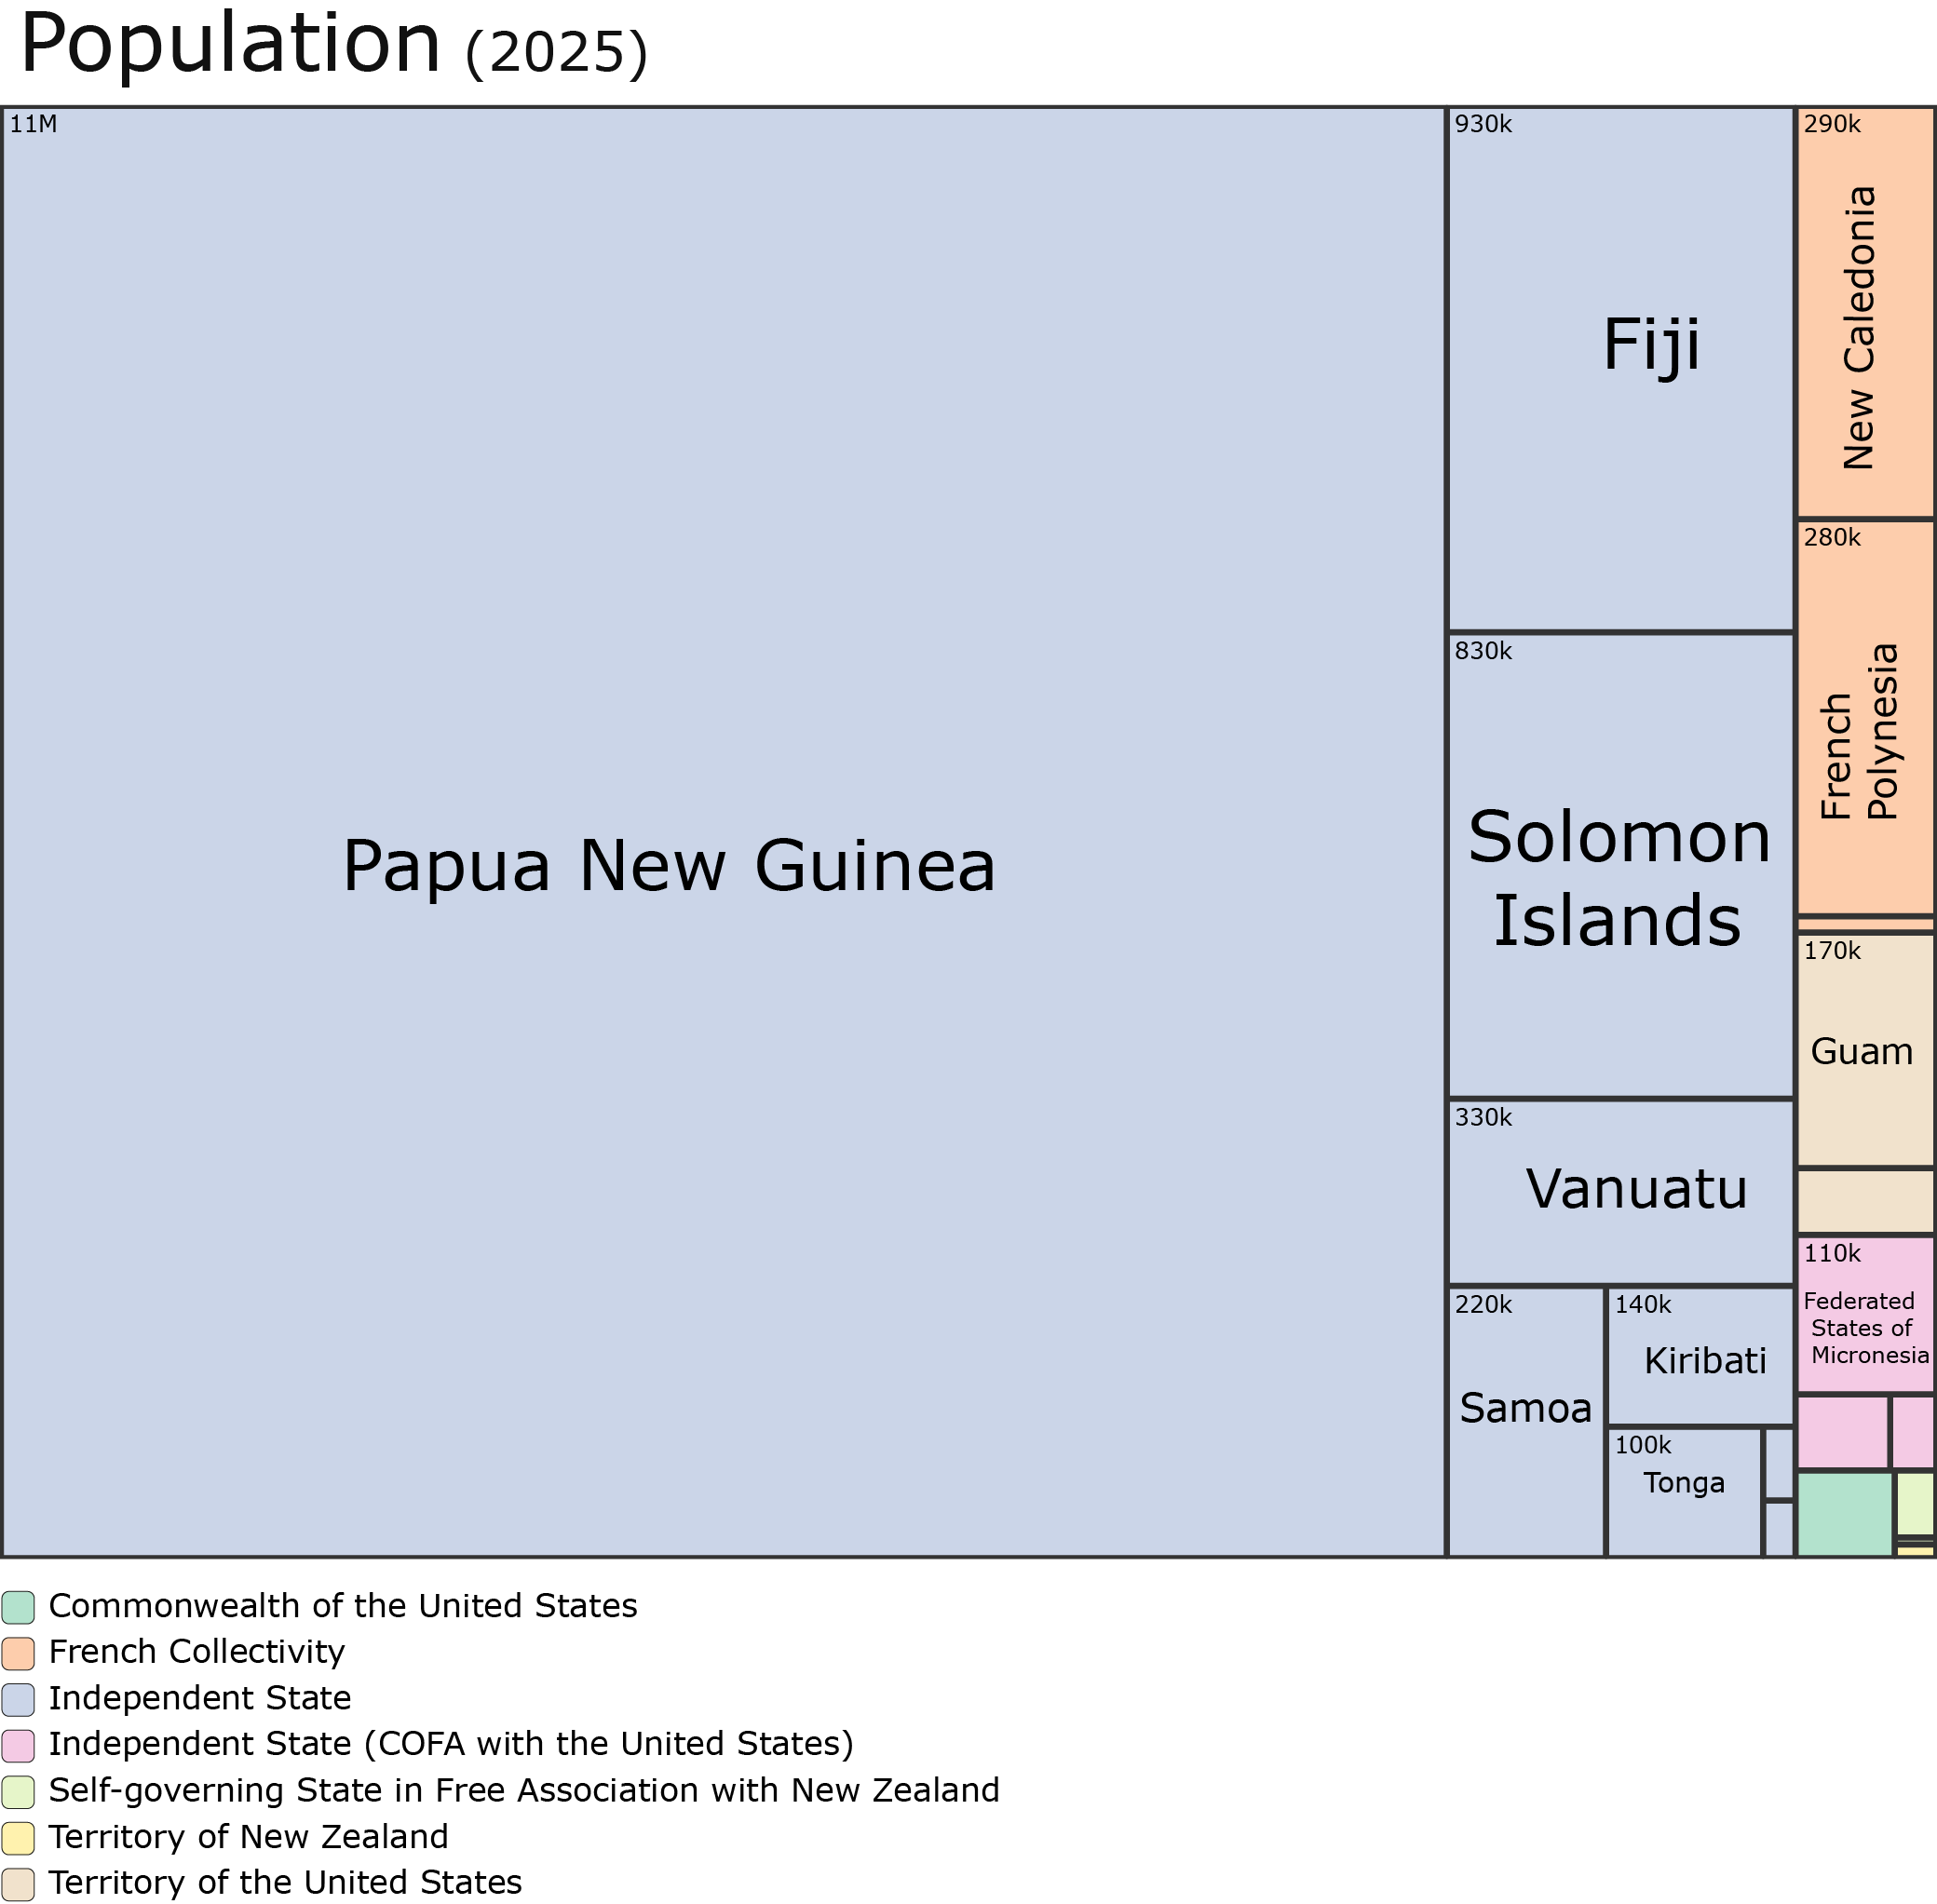
Politically, the region is equally fragmented. Excluding Australia and New Zealand, there are only twelve fully independent states. The rest operate with varying degrees of autonomy but remain tied to Western powers like the United States, France, and New Zealand.
Let's dig deeper into the data shaping this region.
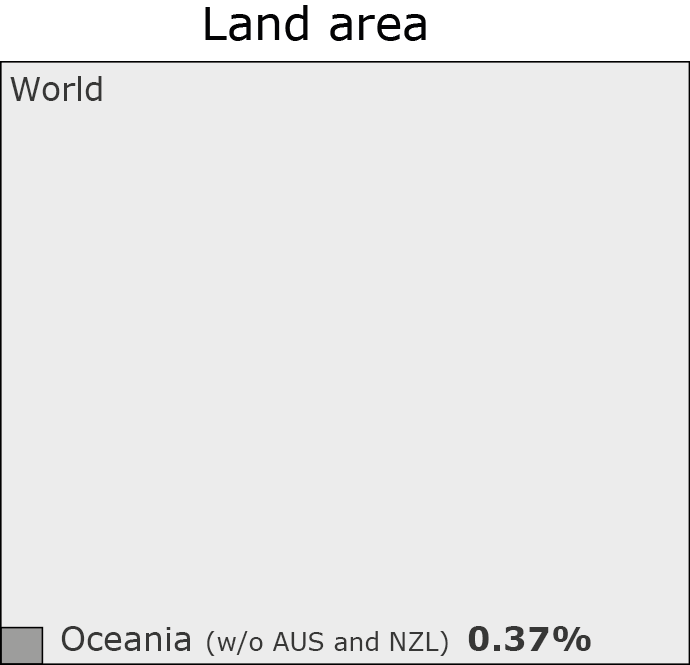
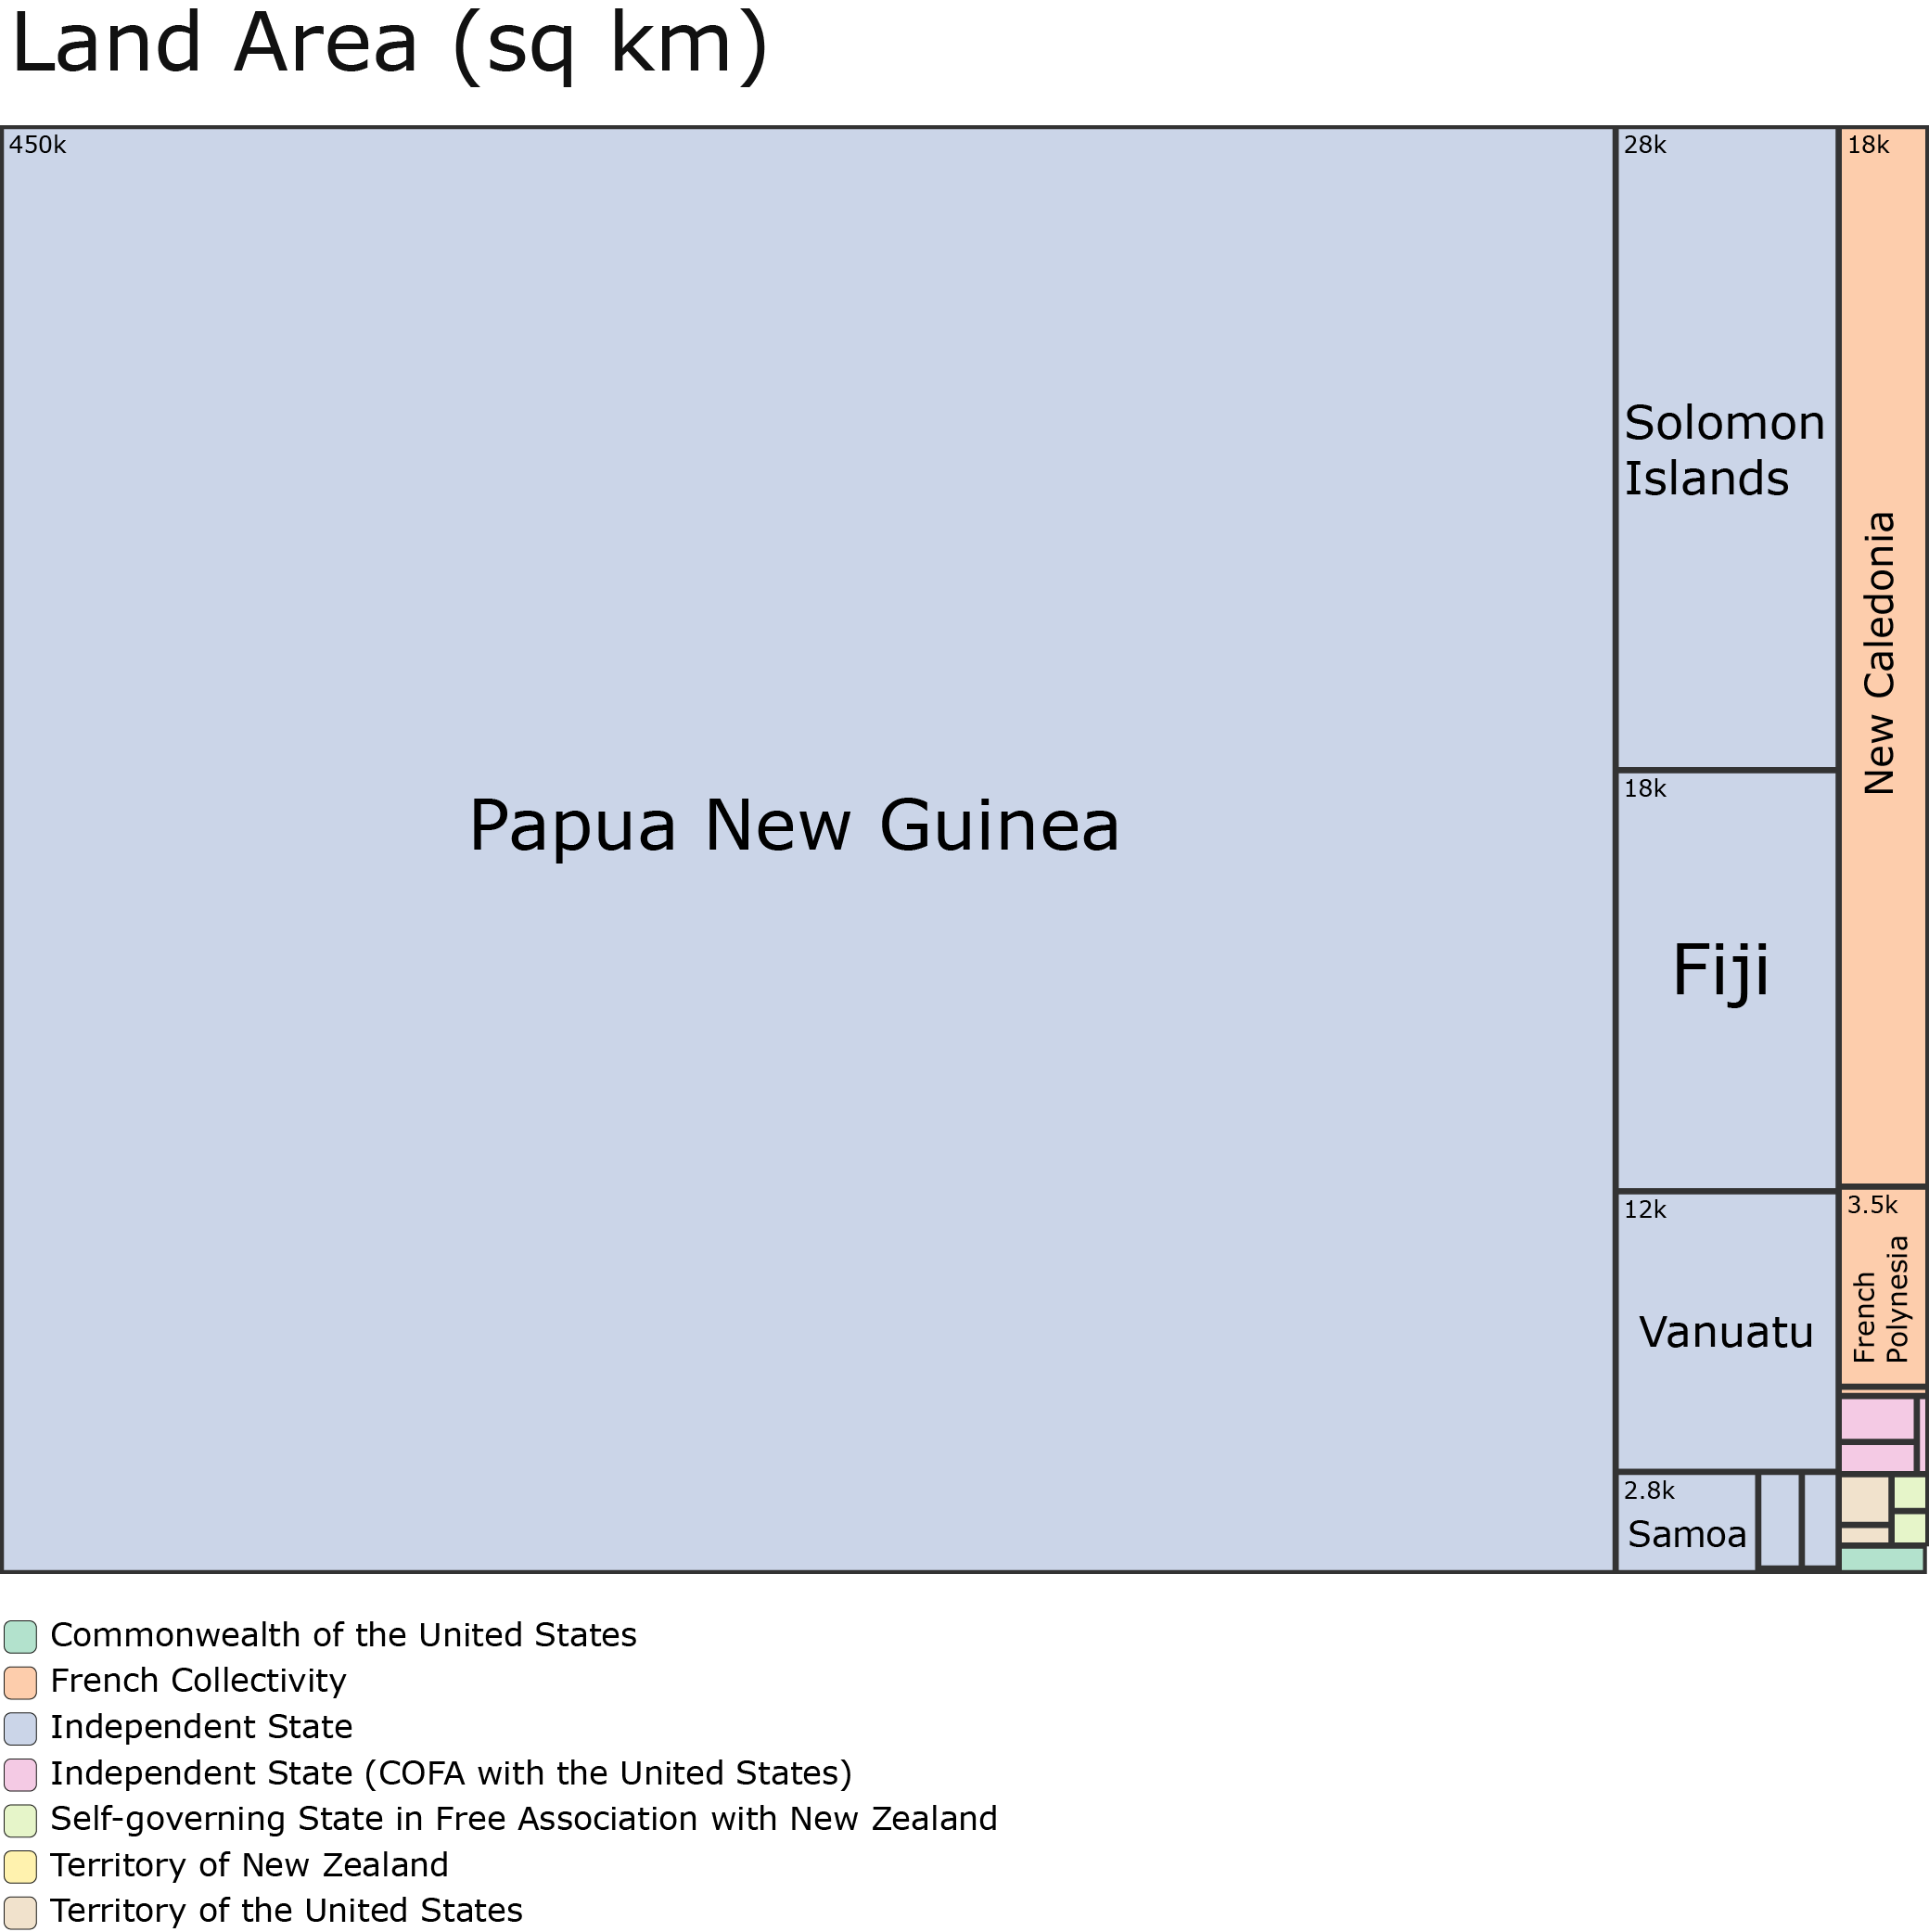
Oceania accounts for less than 0.5% of the world's land area. When you look closer, the distribution of that land is strikingly unequal. 98% of the region's land area belongs to just five independent nations: Papua New Guinea, the Solomon Islands, Fiji, Vanuatu, and Samoa. Papua New Guinea is the undisputed giant among them, claiming more than 84% of the total land cover all by itself.
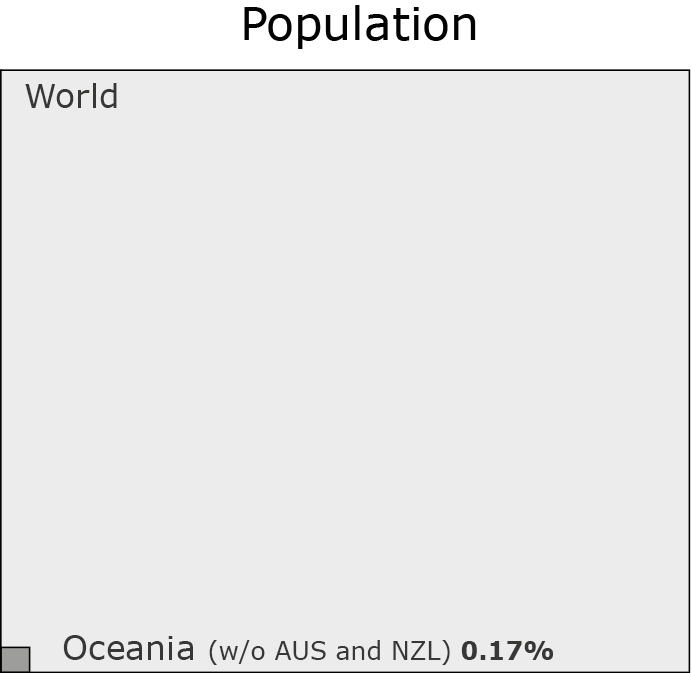
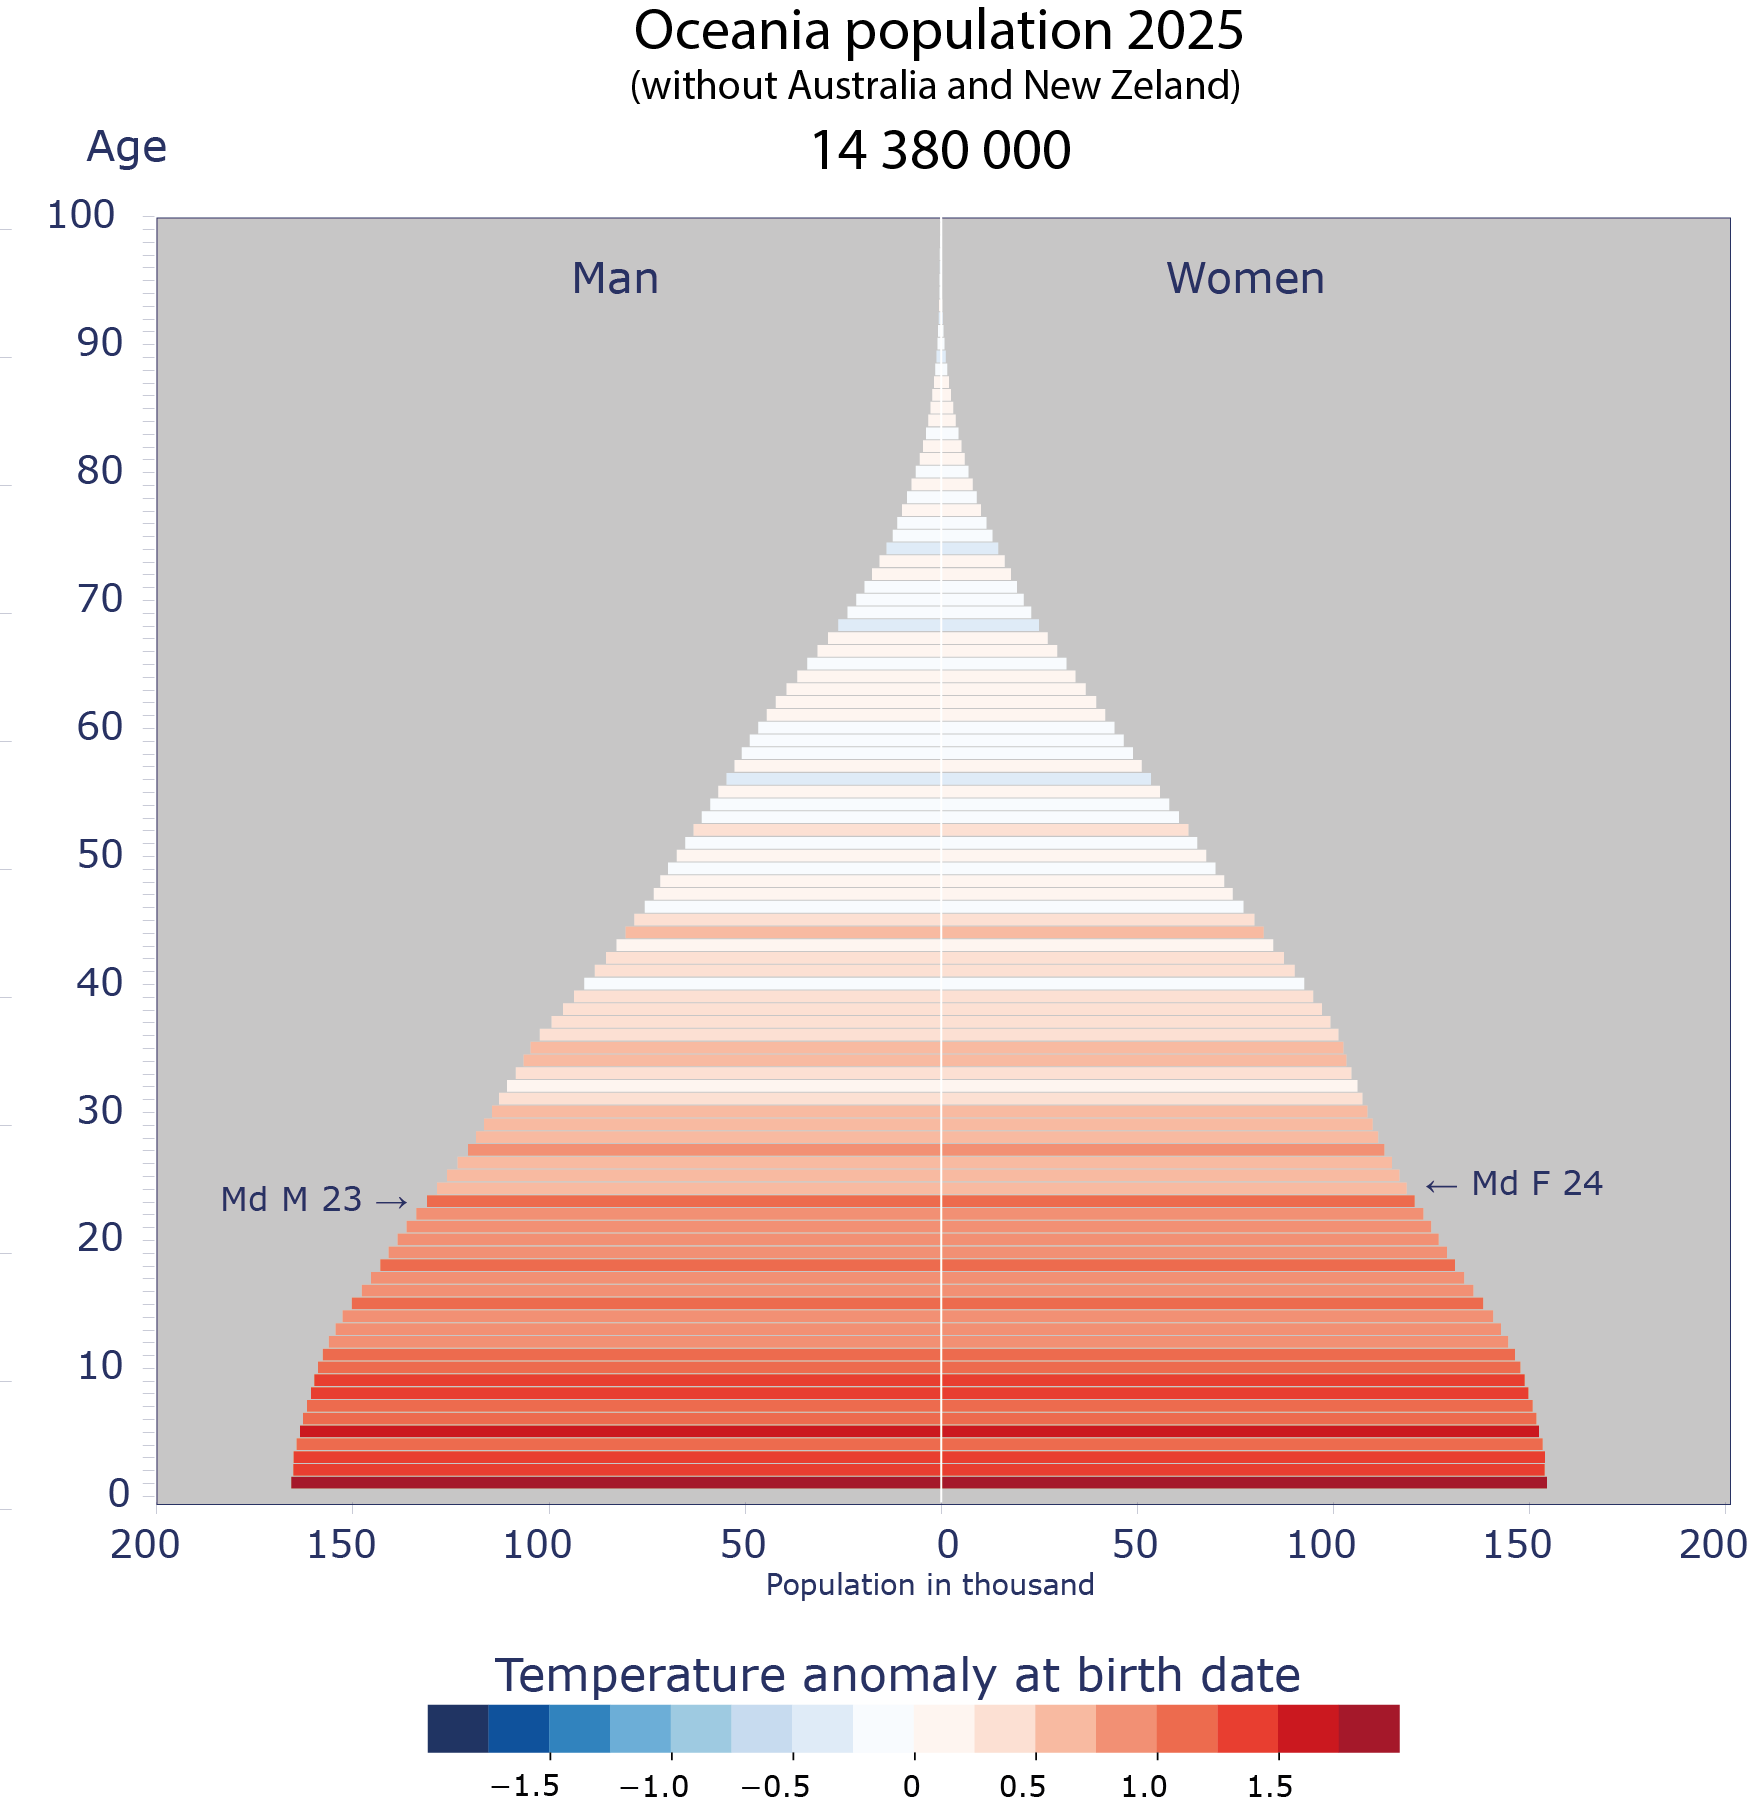
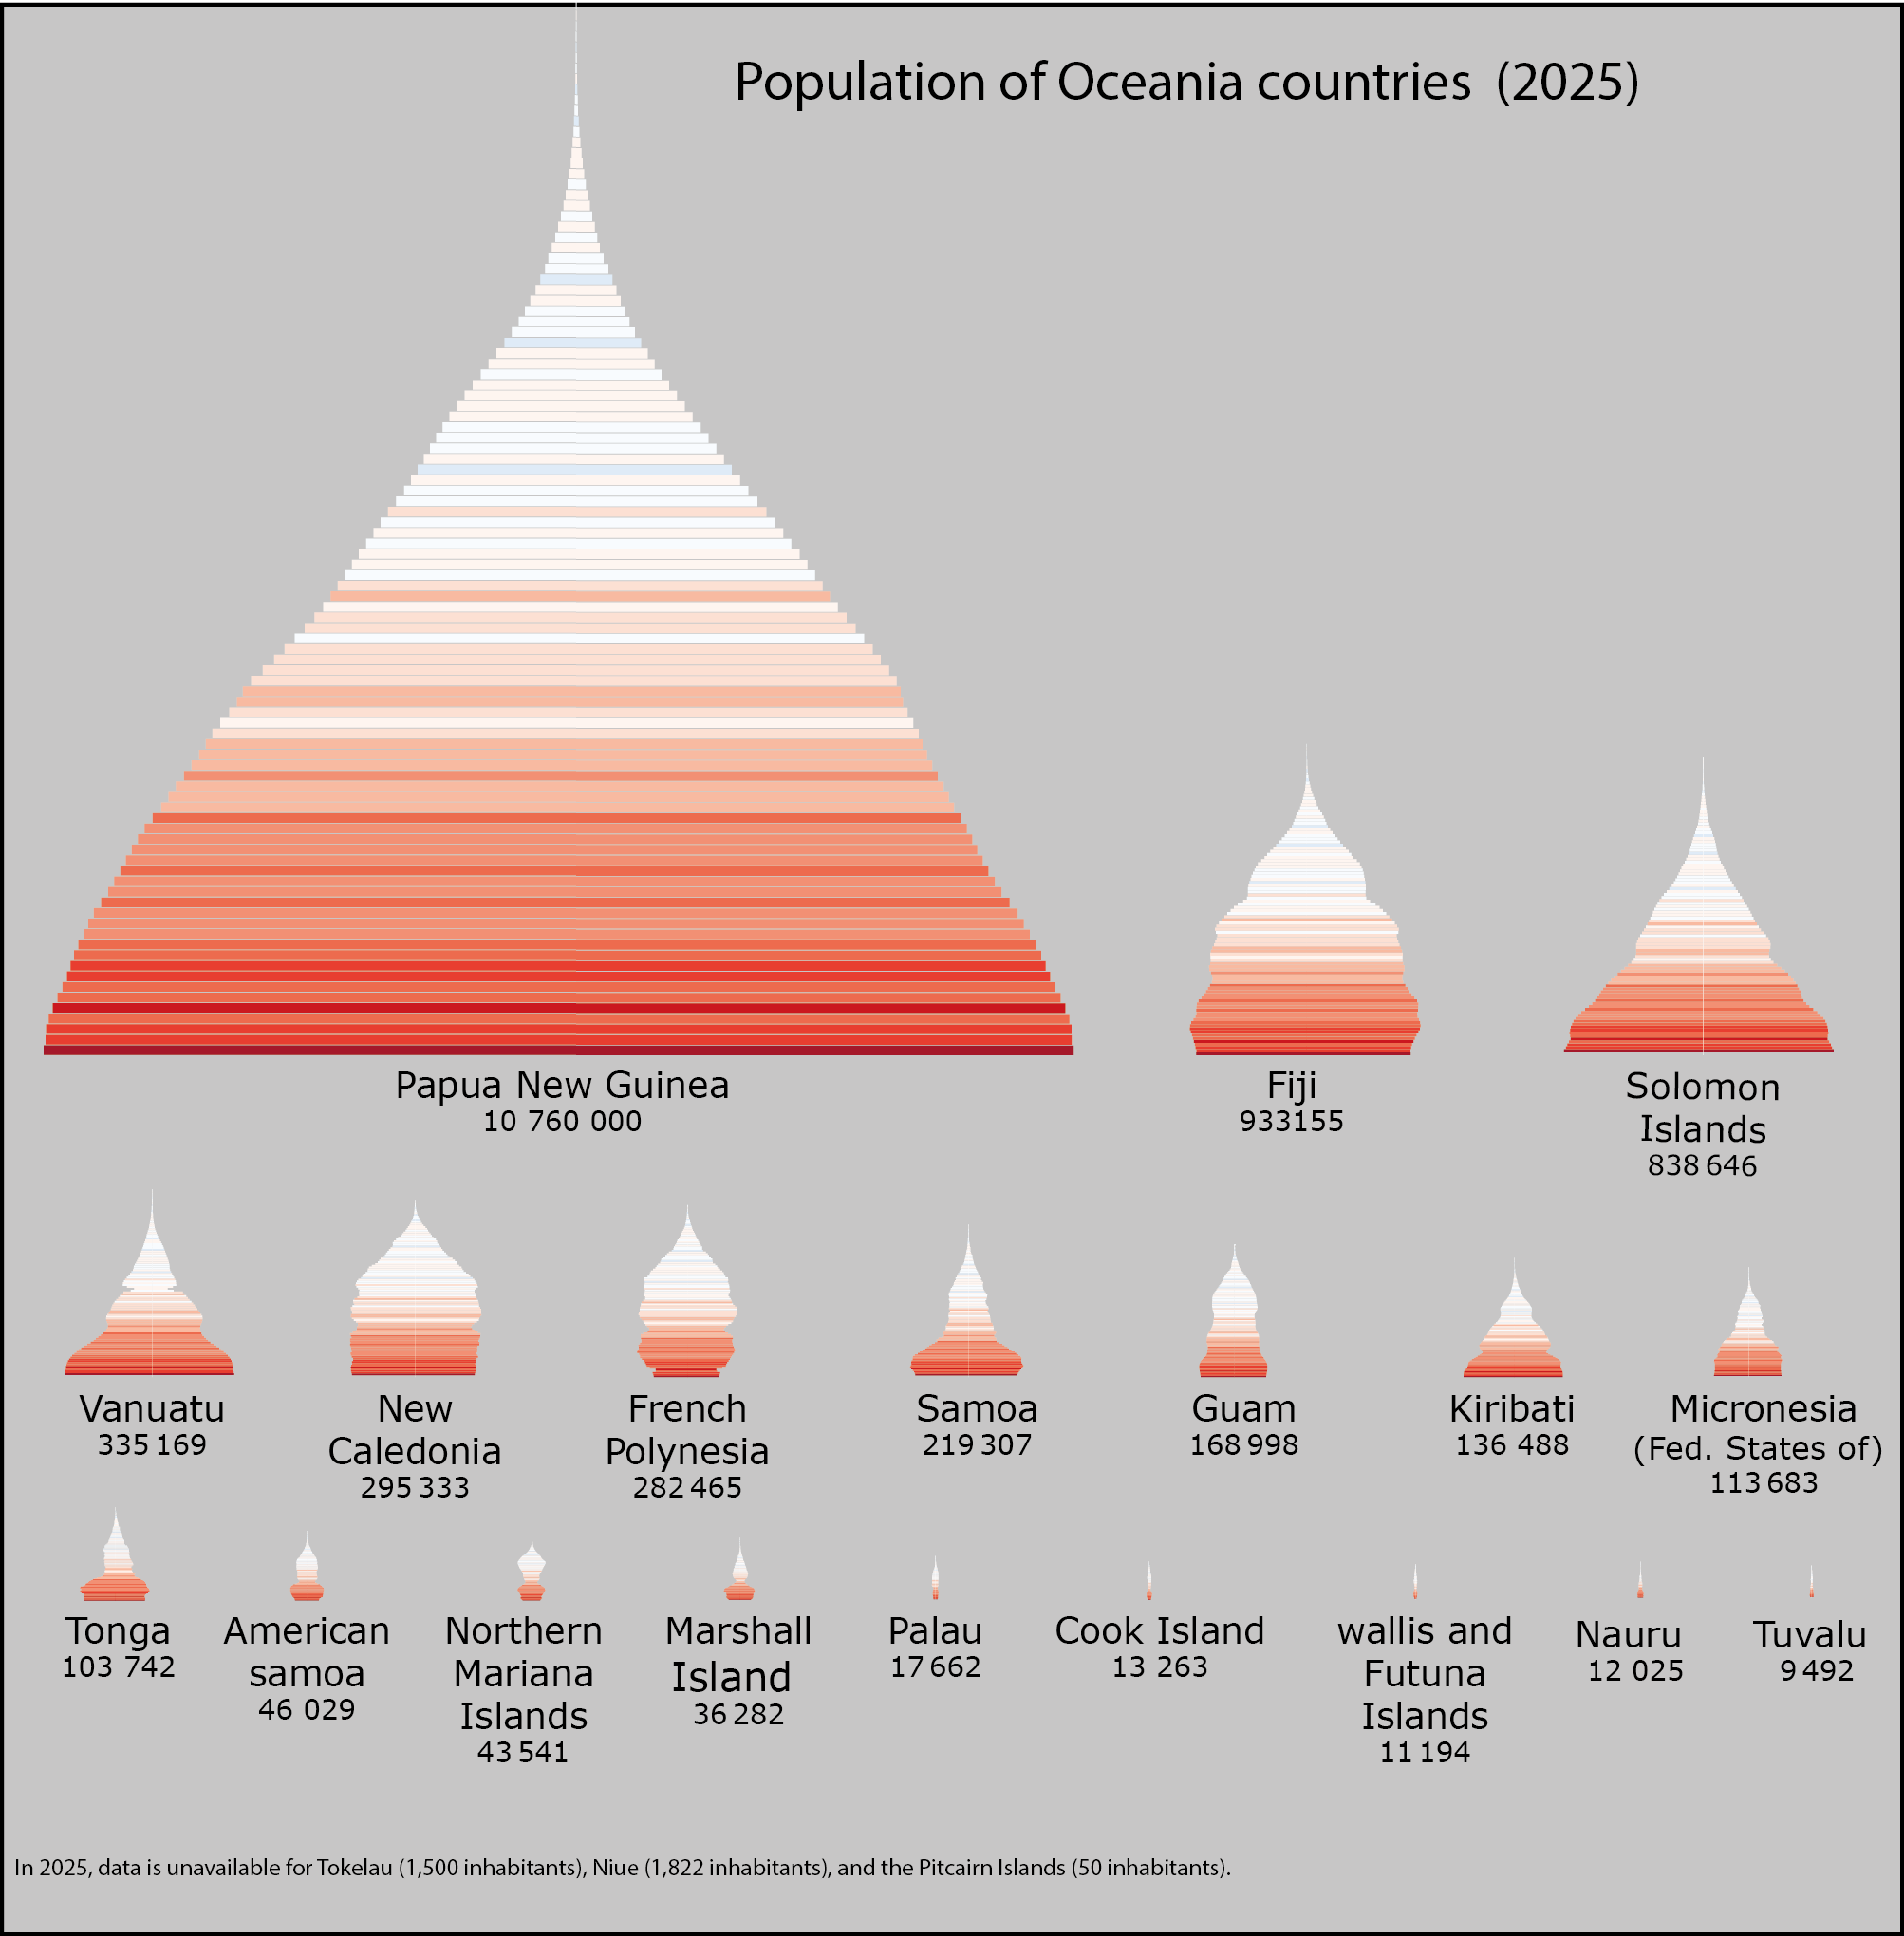
Oceania is home to just 14.4 million people, making up 0.17% of the world's total population. To understand the future of this population, let's examine an unusual version of its age pyramid that highlights the temperature anomaly present at the birth of each generation.
Here is how to interpret this visualization:
The first insight is Oceania's striking youth. The region's median age is just 24 years old. While high birth rates offer a strong foundation for future economic growth, they also come with a heavy burden. These younger generations are inheriting a warming world and will have to deal with the consequences of climate change throughout their lives.
Population distribution across Oceania is highly uneven. The five independent states with the largest landmasses also hold the vast majority of the region's people.
New Caledonia and Vanuatu offer a striking demographic contrast. New Caledonia features a top-heavy age pyramid with a high median age and low birth rates, signaling a shrinking, aging population. In contrast, Vanuatu displays a wide-based, expansive pyramid, with over 60% of its people under age 25.
At the other extreme, five territories, Palau, the Cook Islands, Wallis and Futuna, Nauru, and Tuvalu, have populations under 20,000. Each is roughly the size of a small Western town.
(To explore the historical population trends of each country, visit: this interactive visualization .)
Now, let's explore Oceania's true wealth: the sea.
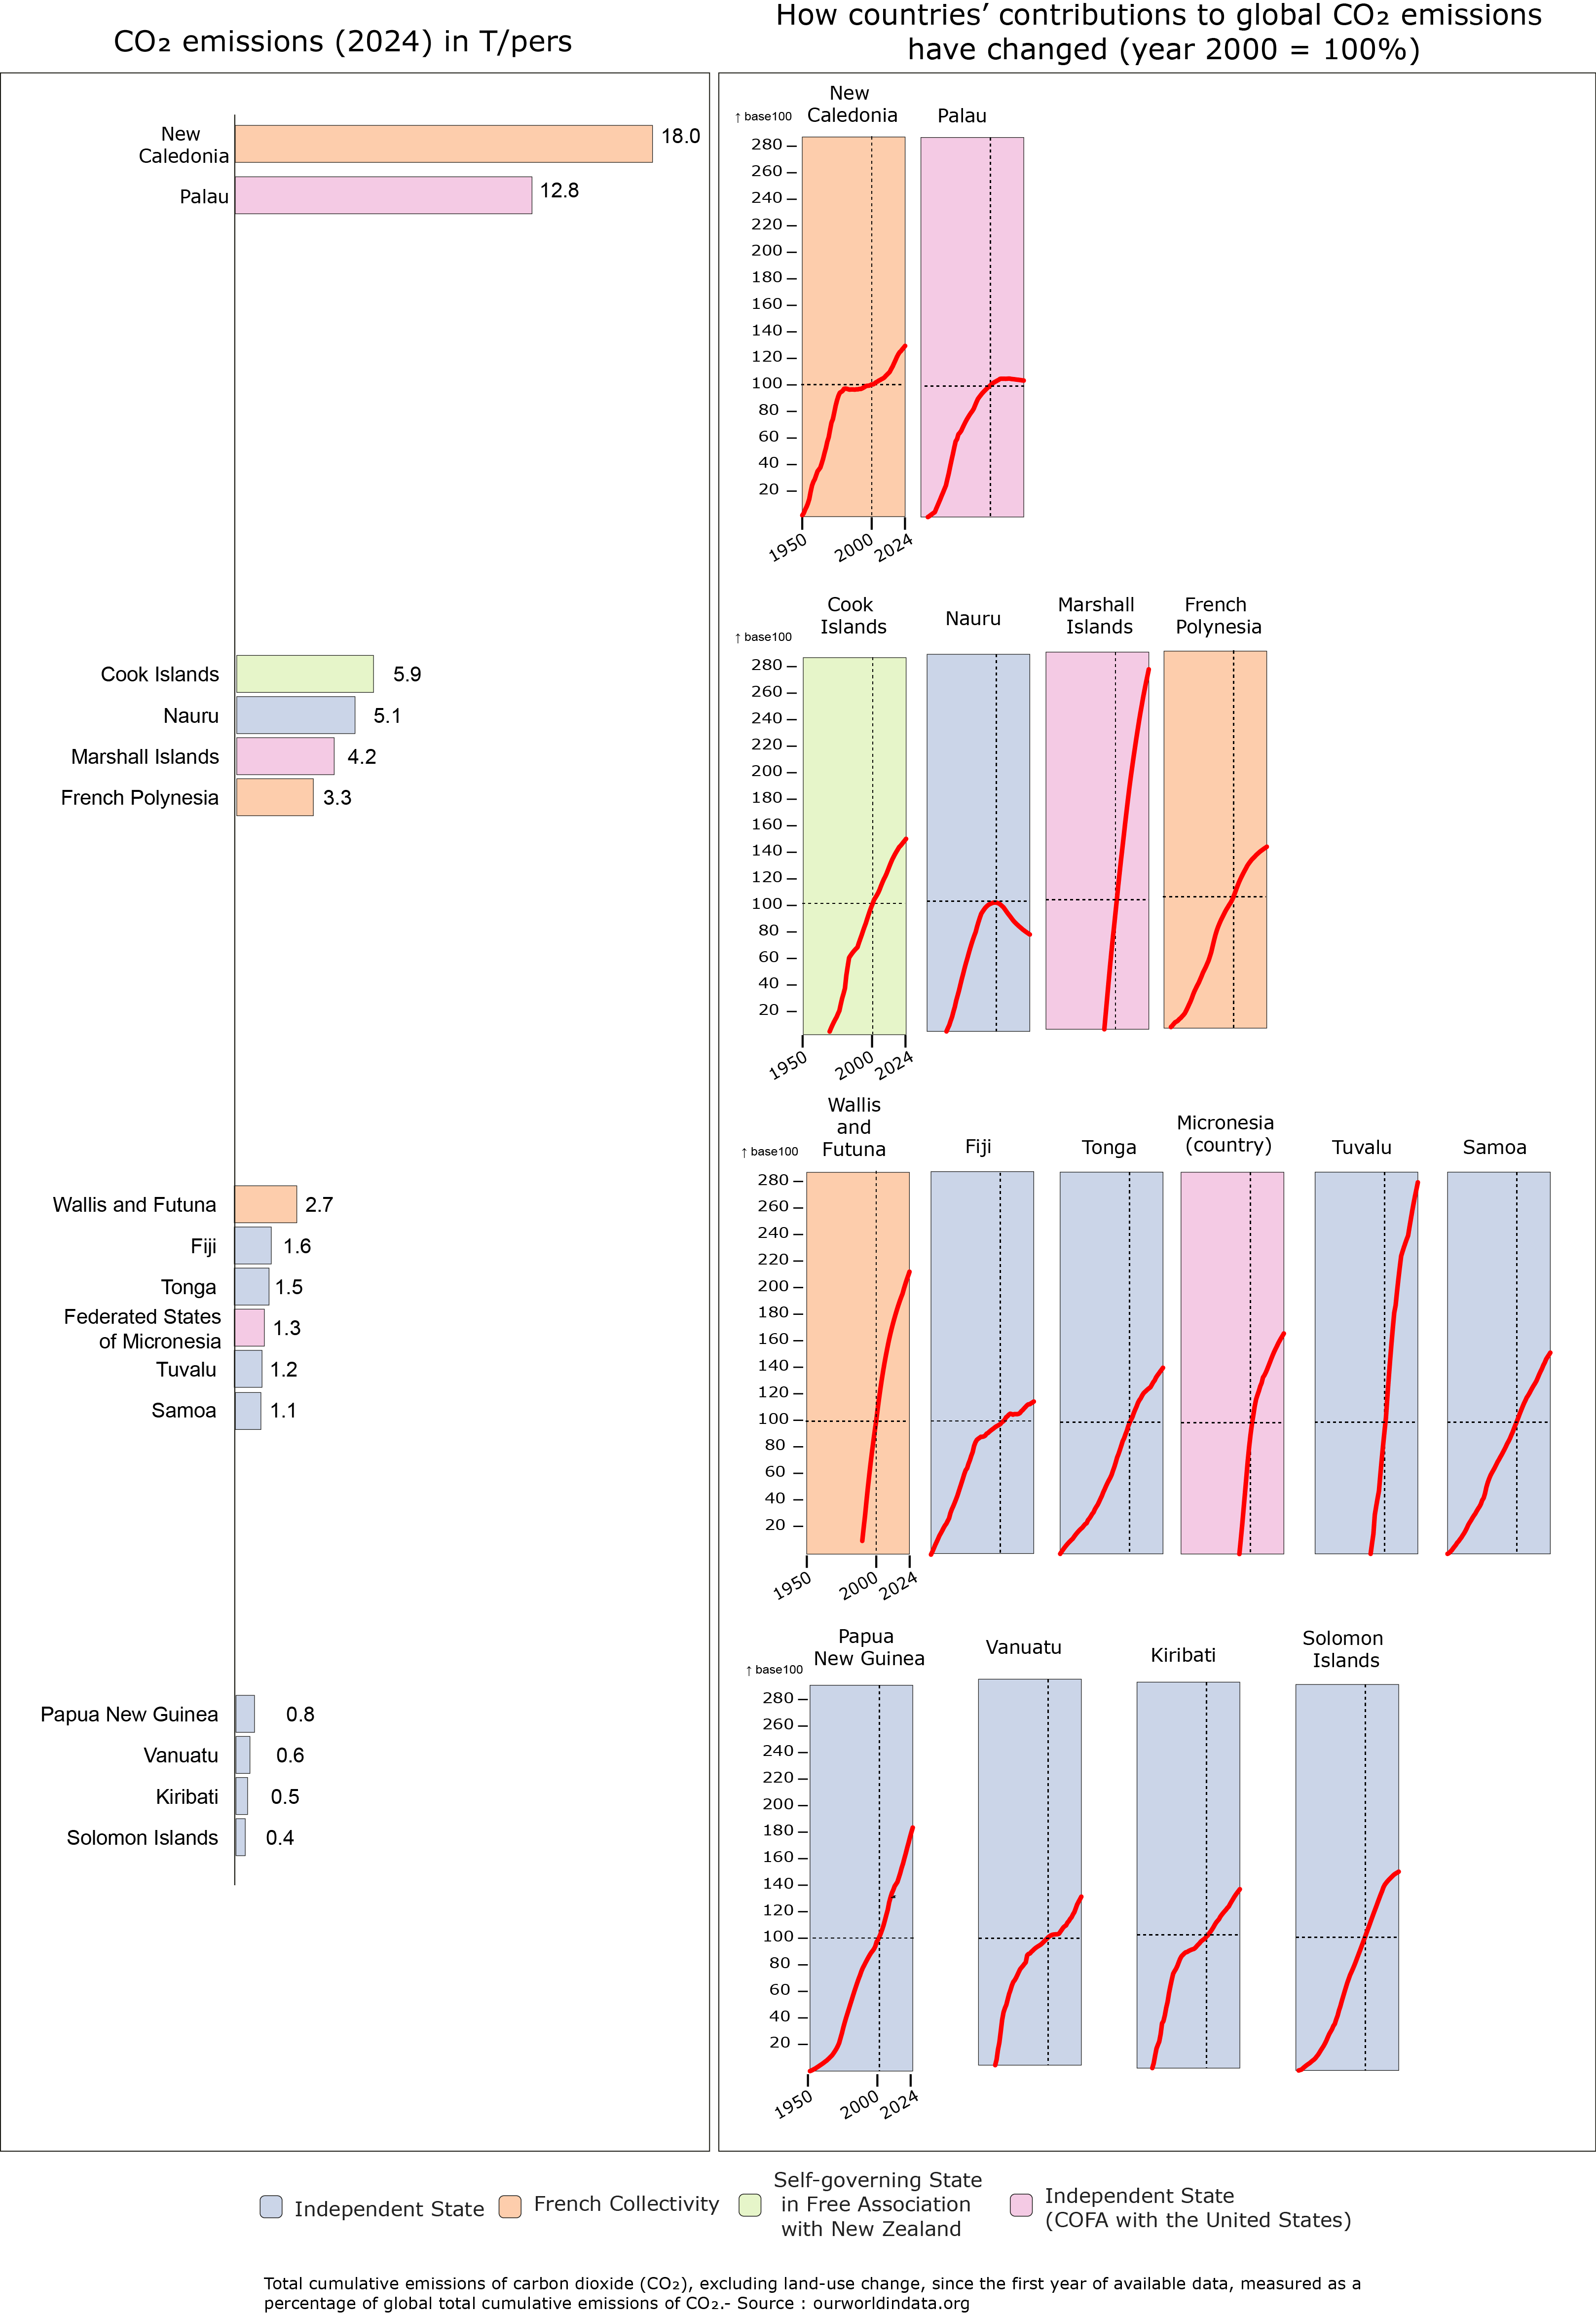
How has the share of cumulative CO2 emissions evolved for oceanic countries?
Total CO₂ emissions from Pacific Island countries and territories (excluding Australia and New Zealand) remain extremely low, accounting for just 0.05% of global emissions. A closer look at per capita CO₂ emissions(*) and global footprints shows that the Pacific's carbon footprint is far from uniform, splitting the region into four distinct clusters:
A striking political pattern also appears in the data: many independent Pacific island states have very low per-capita emissions, while several territories politically associated with wealthier Western economies have much higher emissions. However, political status alone does not explain this gap; economic structure, industrial activity, energy systems and income levels are likely important factors.
(*) Carbon dioxide (CO₂) emissions from burning fossil fuels and industrial processes. This includes emissions from transport, electricity generation, and heating, but not land-use change.
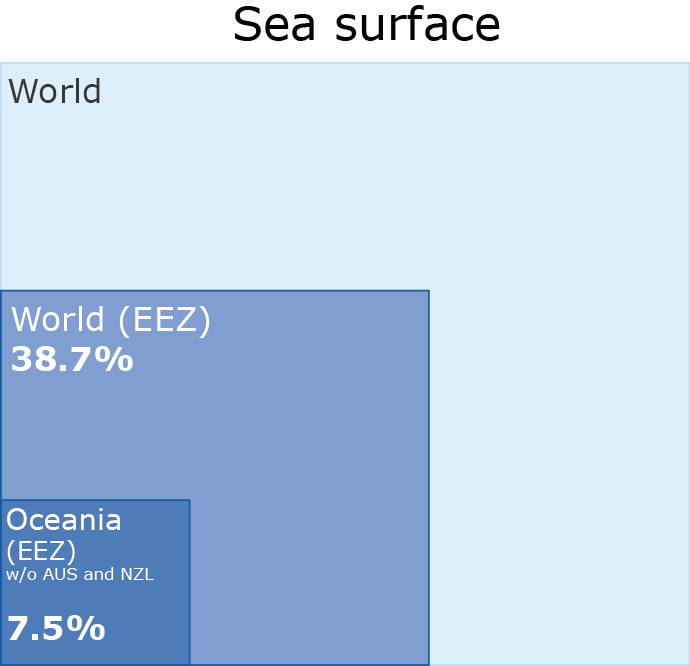
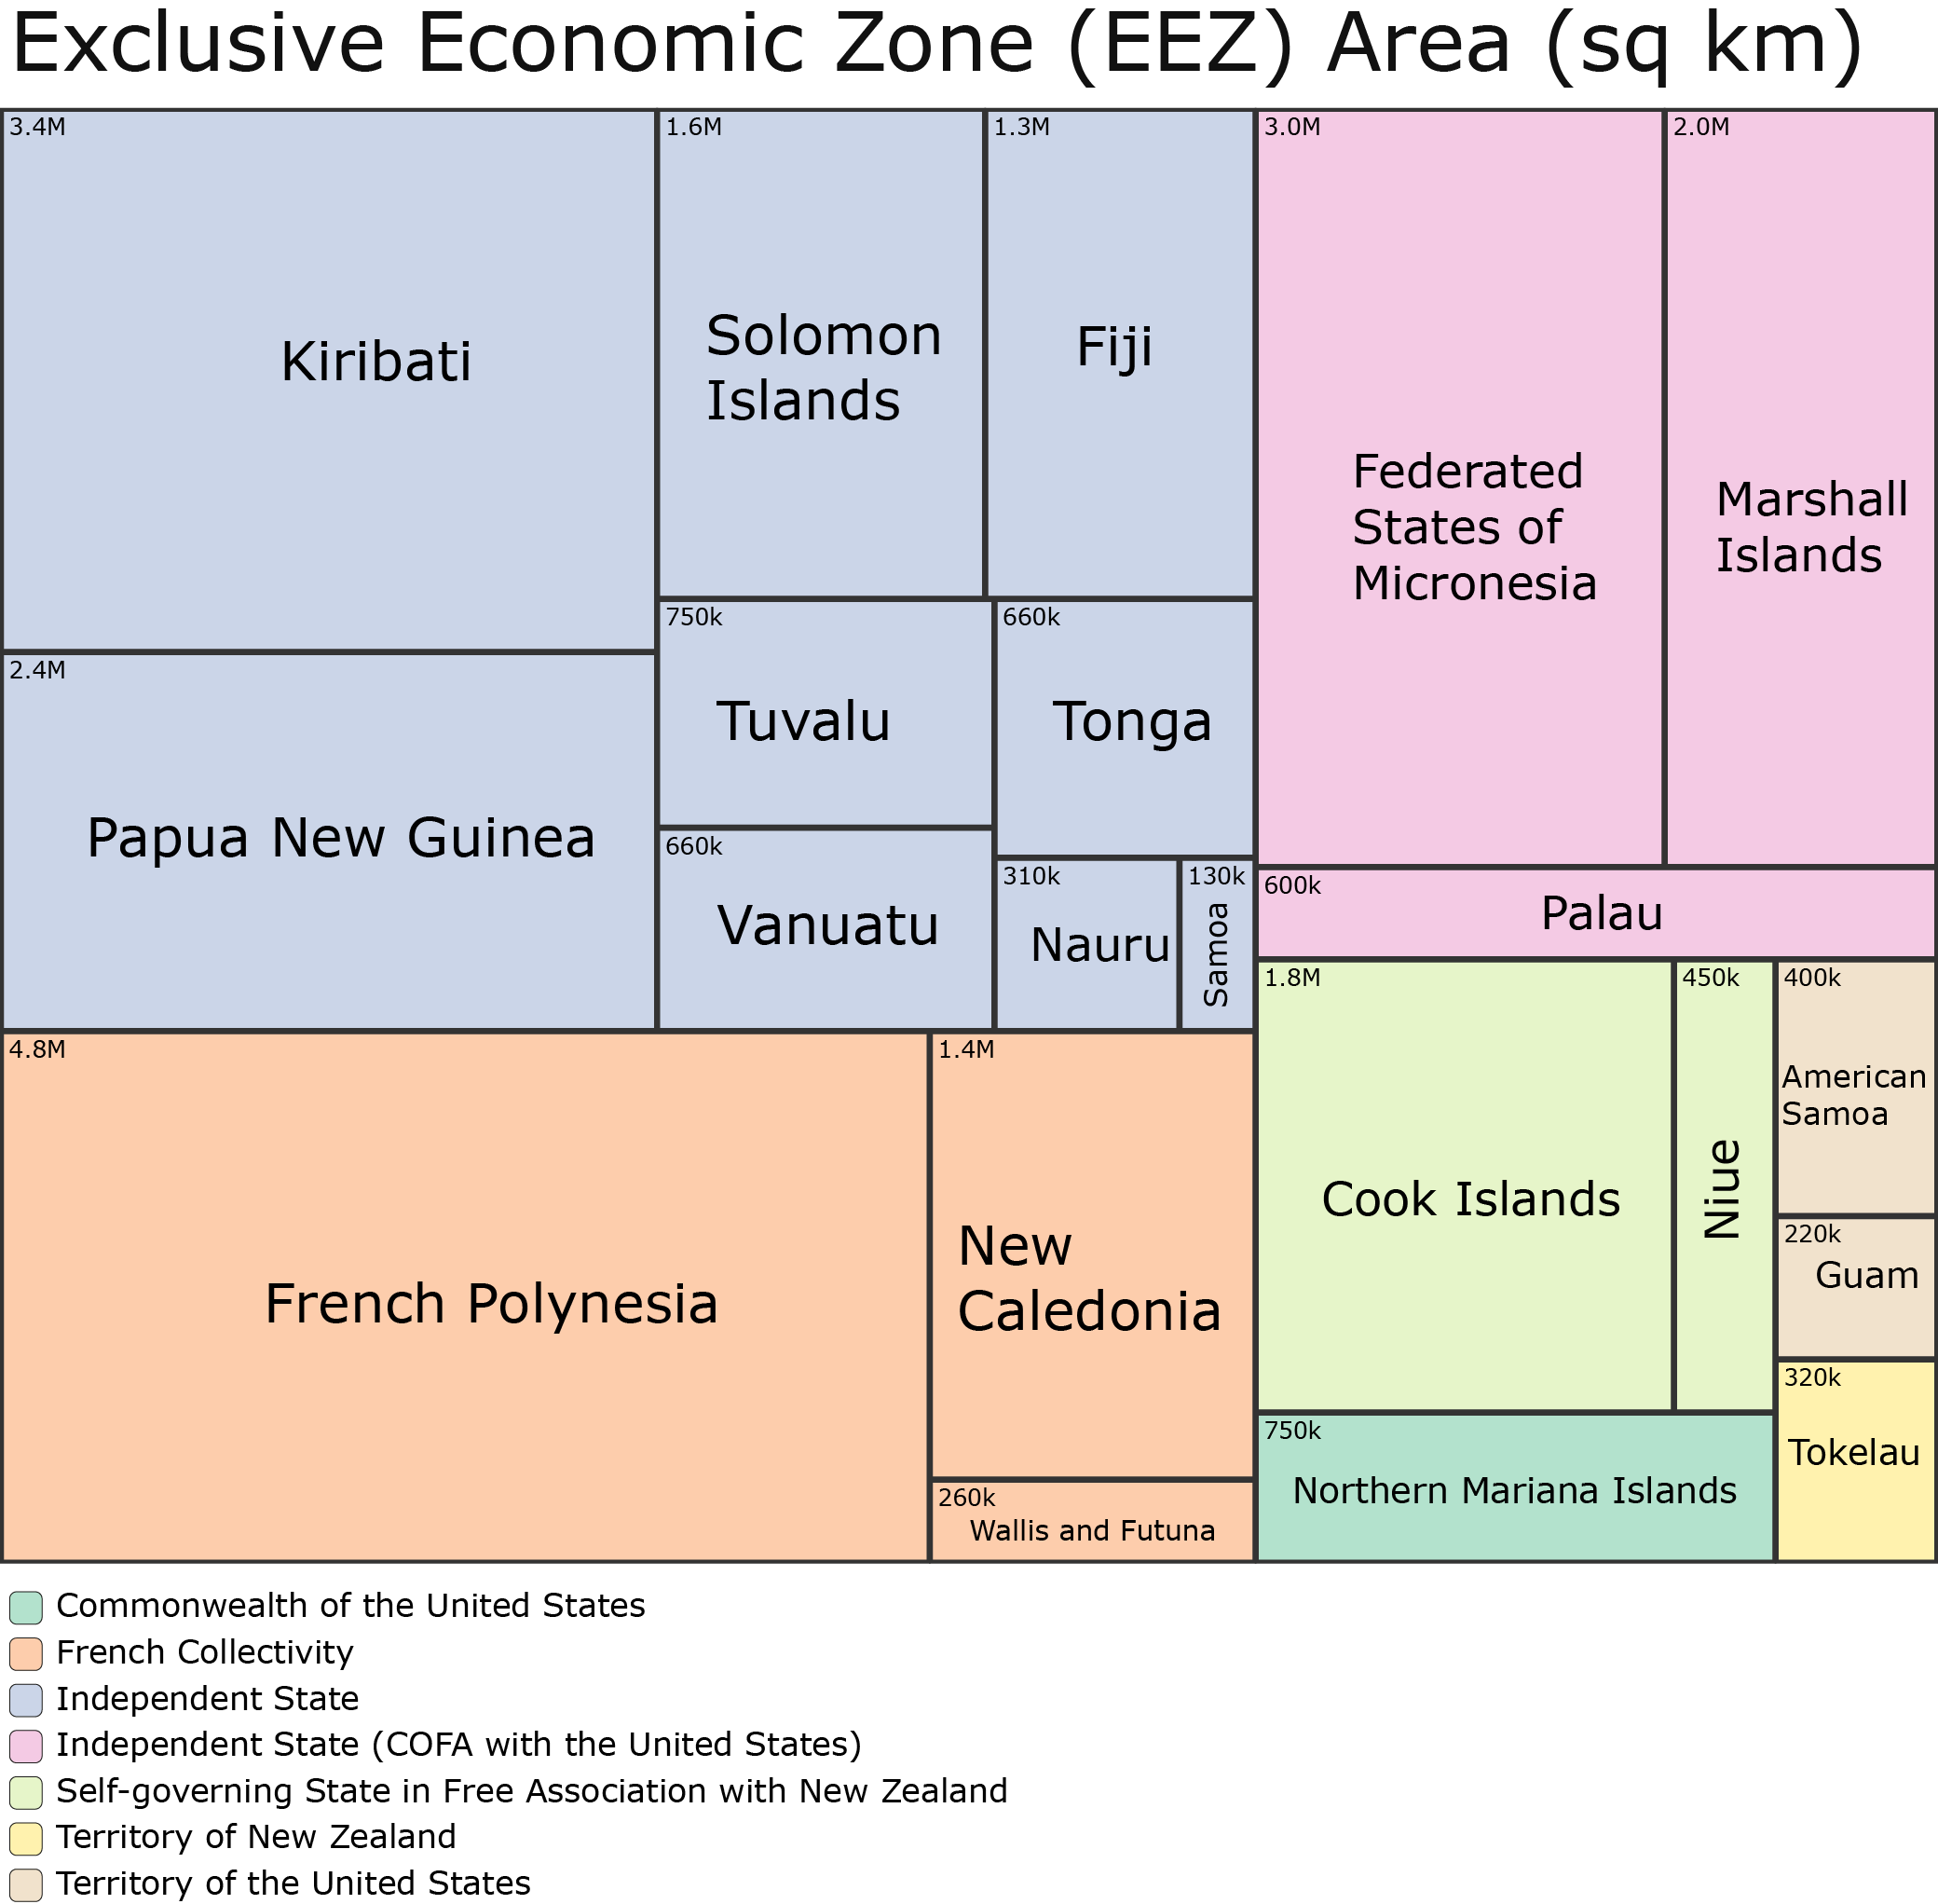
On paper, Oceania seems tiny, accounting for a fraction of global population and land. But step into the water, and its true power emerges. The region commands almost 20% of the world's Exclusive Economic Zones (EEZs). This provides immense economic and political weight. This maritime footprint may be its single greatest asset.
Is this ocean wealth spread evenly across these island nations, or does it belong to a select few?
Unlike land mass or population size, the ocean is an incredible equalizer in the Pacific. Regardless of how small a country is or how large its population may be, its share of the sea is vast. Because these island nations have such limited land, the ocean serves as a literal extension of their living space. It is their ultimate lifeblood. The sea provides the daily catch that feeds local communities, the shipping routes essential for trade, and the breathtaking reefs that drive their tourism economies. It is also the anchor of their cultural traditions and their first line of defense, with coral reefs and mangroves shielding them from violent storms. Because they rely on the water for everything from physical survival to economic growth, protecting these marine ecosystems is a major challenge they face today.
How is climate change threatening this priceless asset?
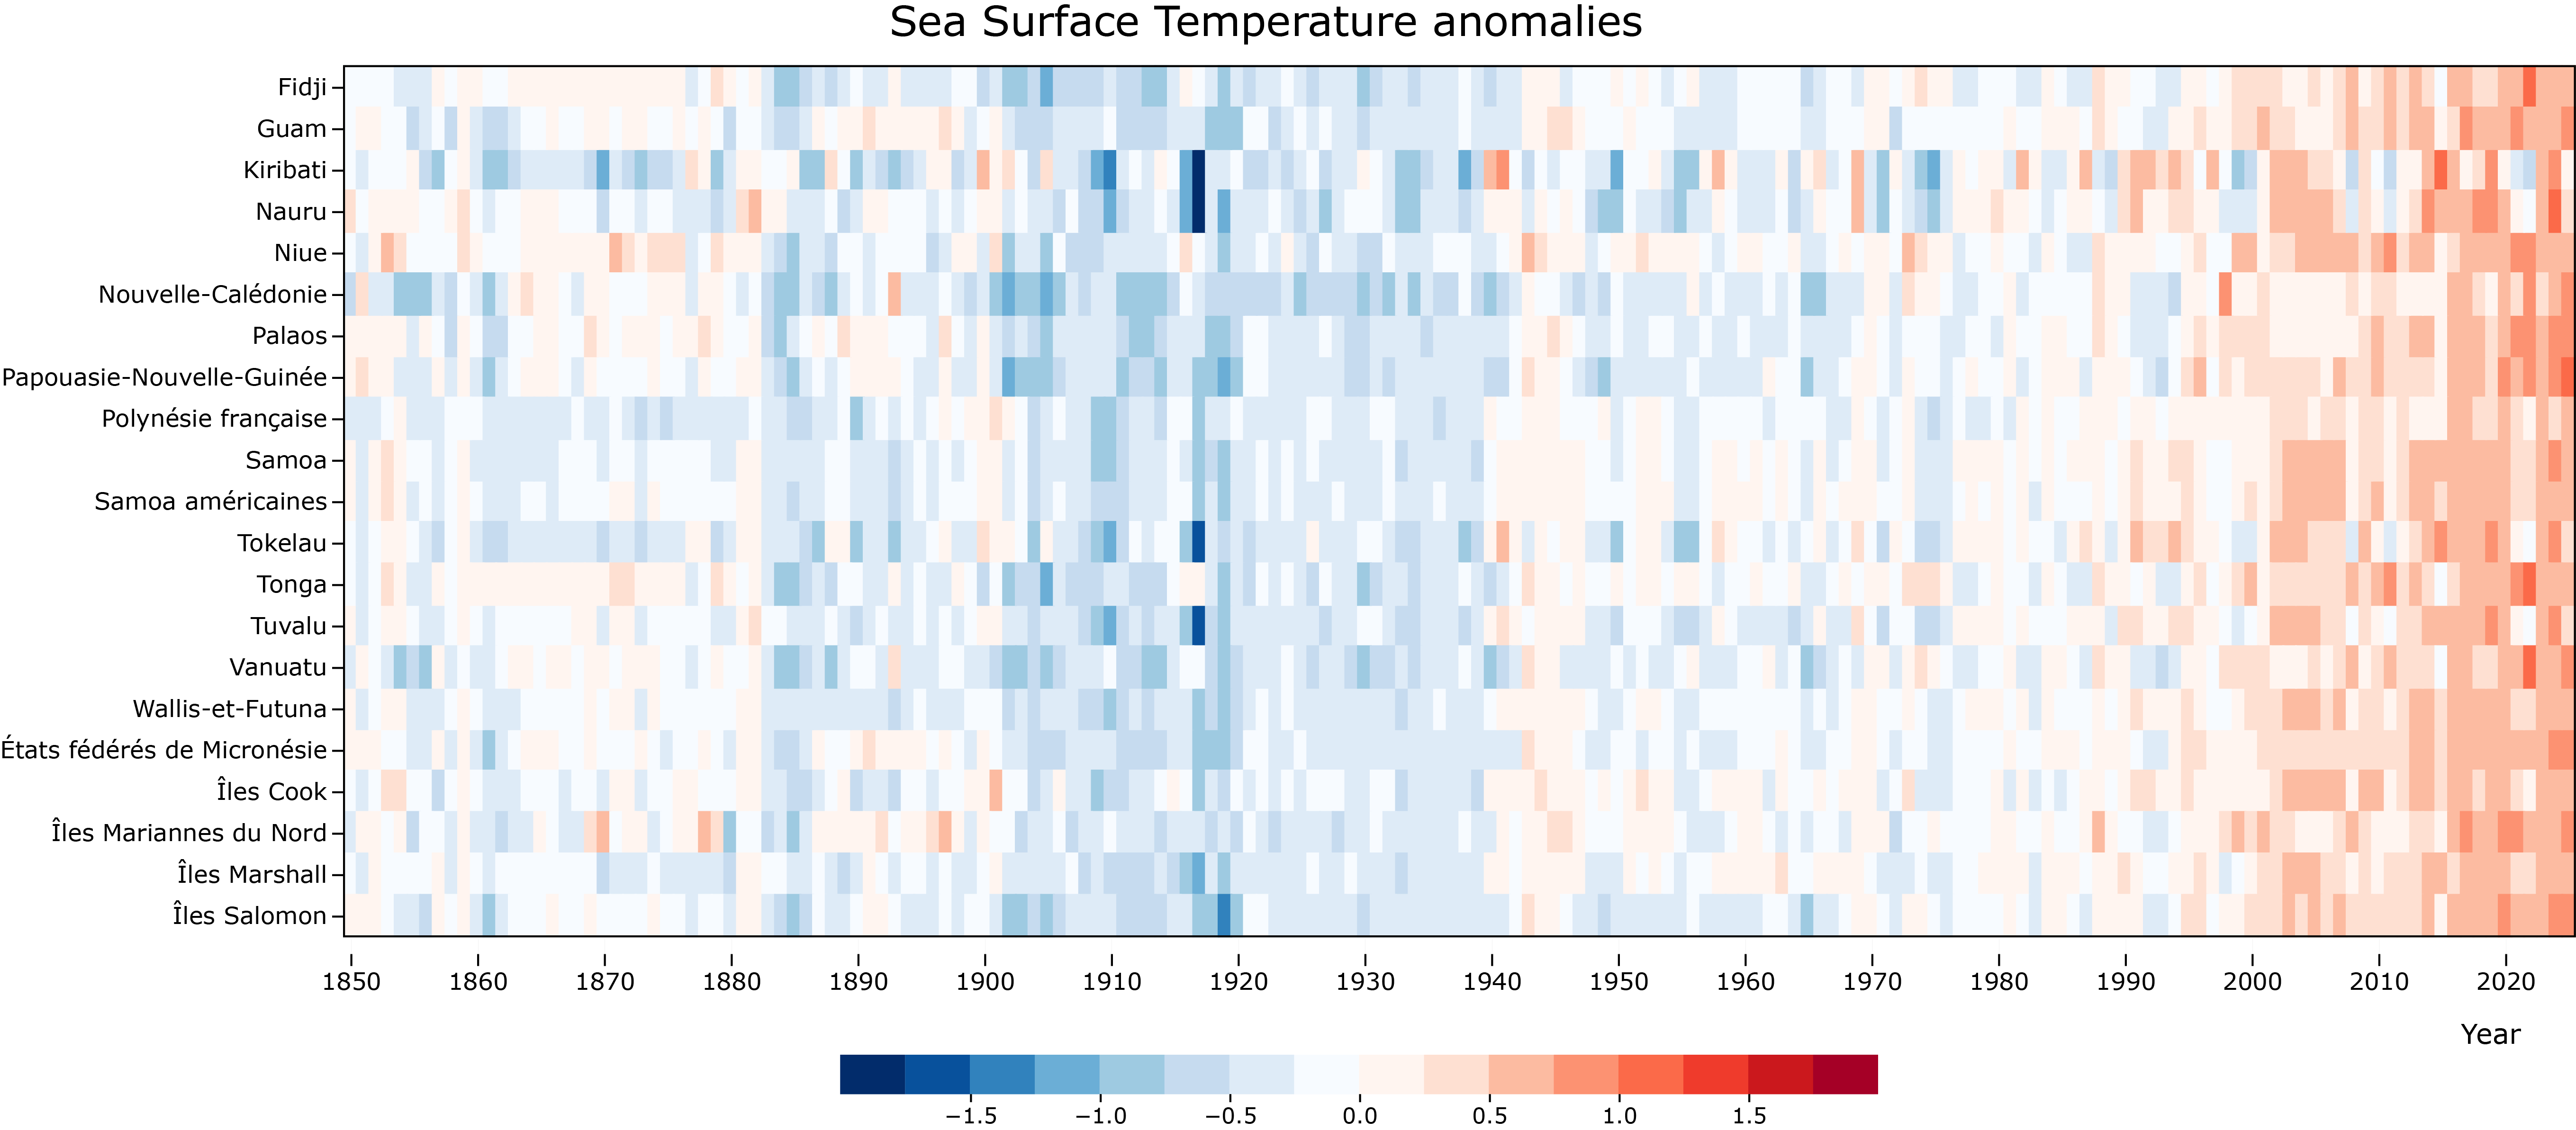
Sea surface temperature anomalies make the reality of climate change undeniable. Since 1990, ocean warming has noticeably accelerated, guaranteeing a future of more frequent and extreme weather events. To survive, the region must urgently implement policies to mitigate these impacts.
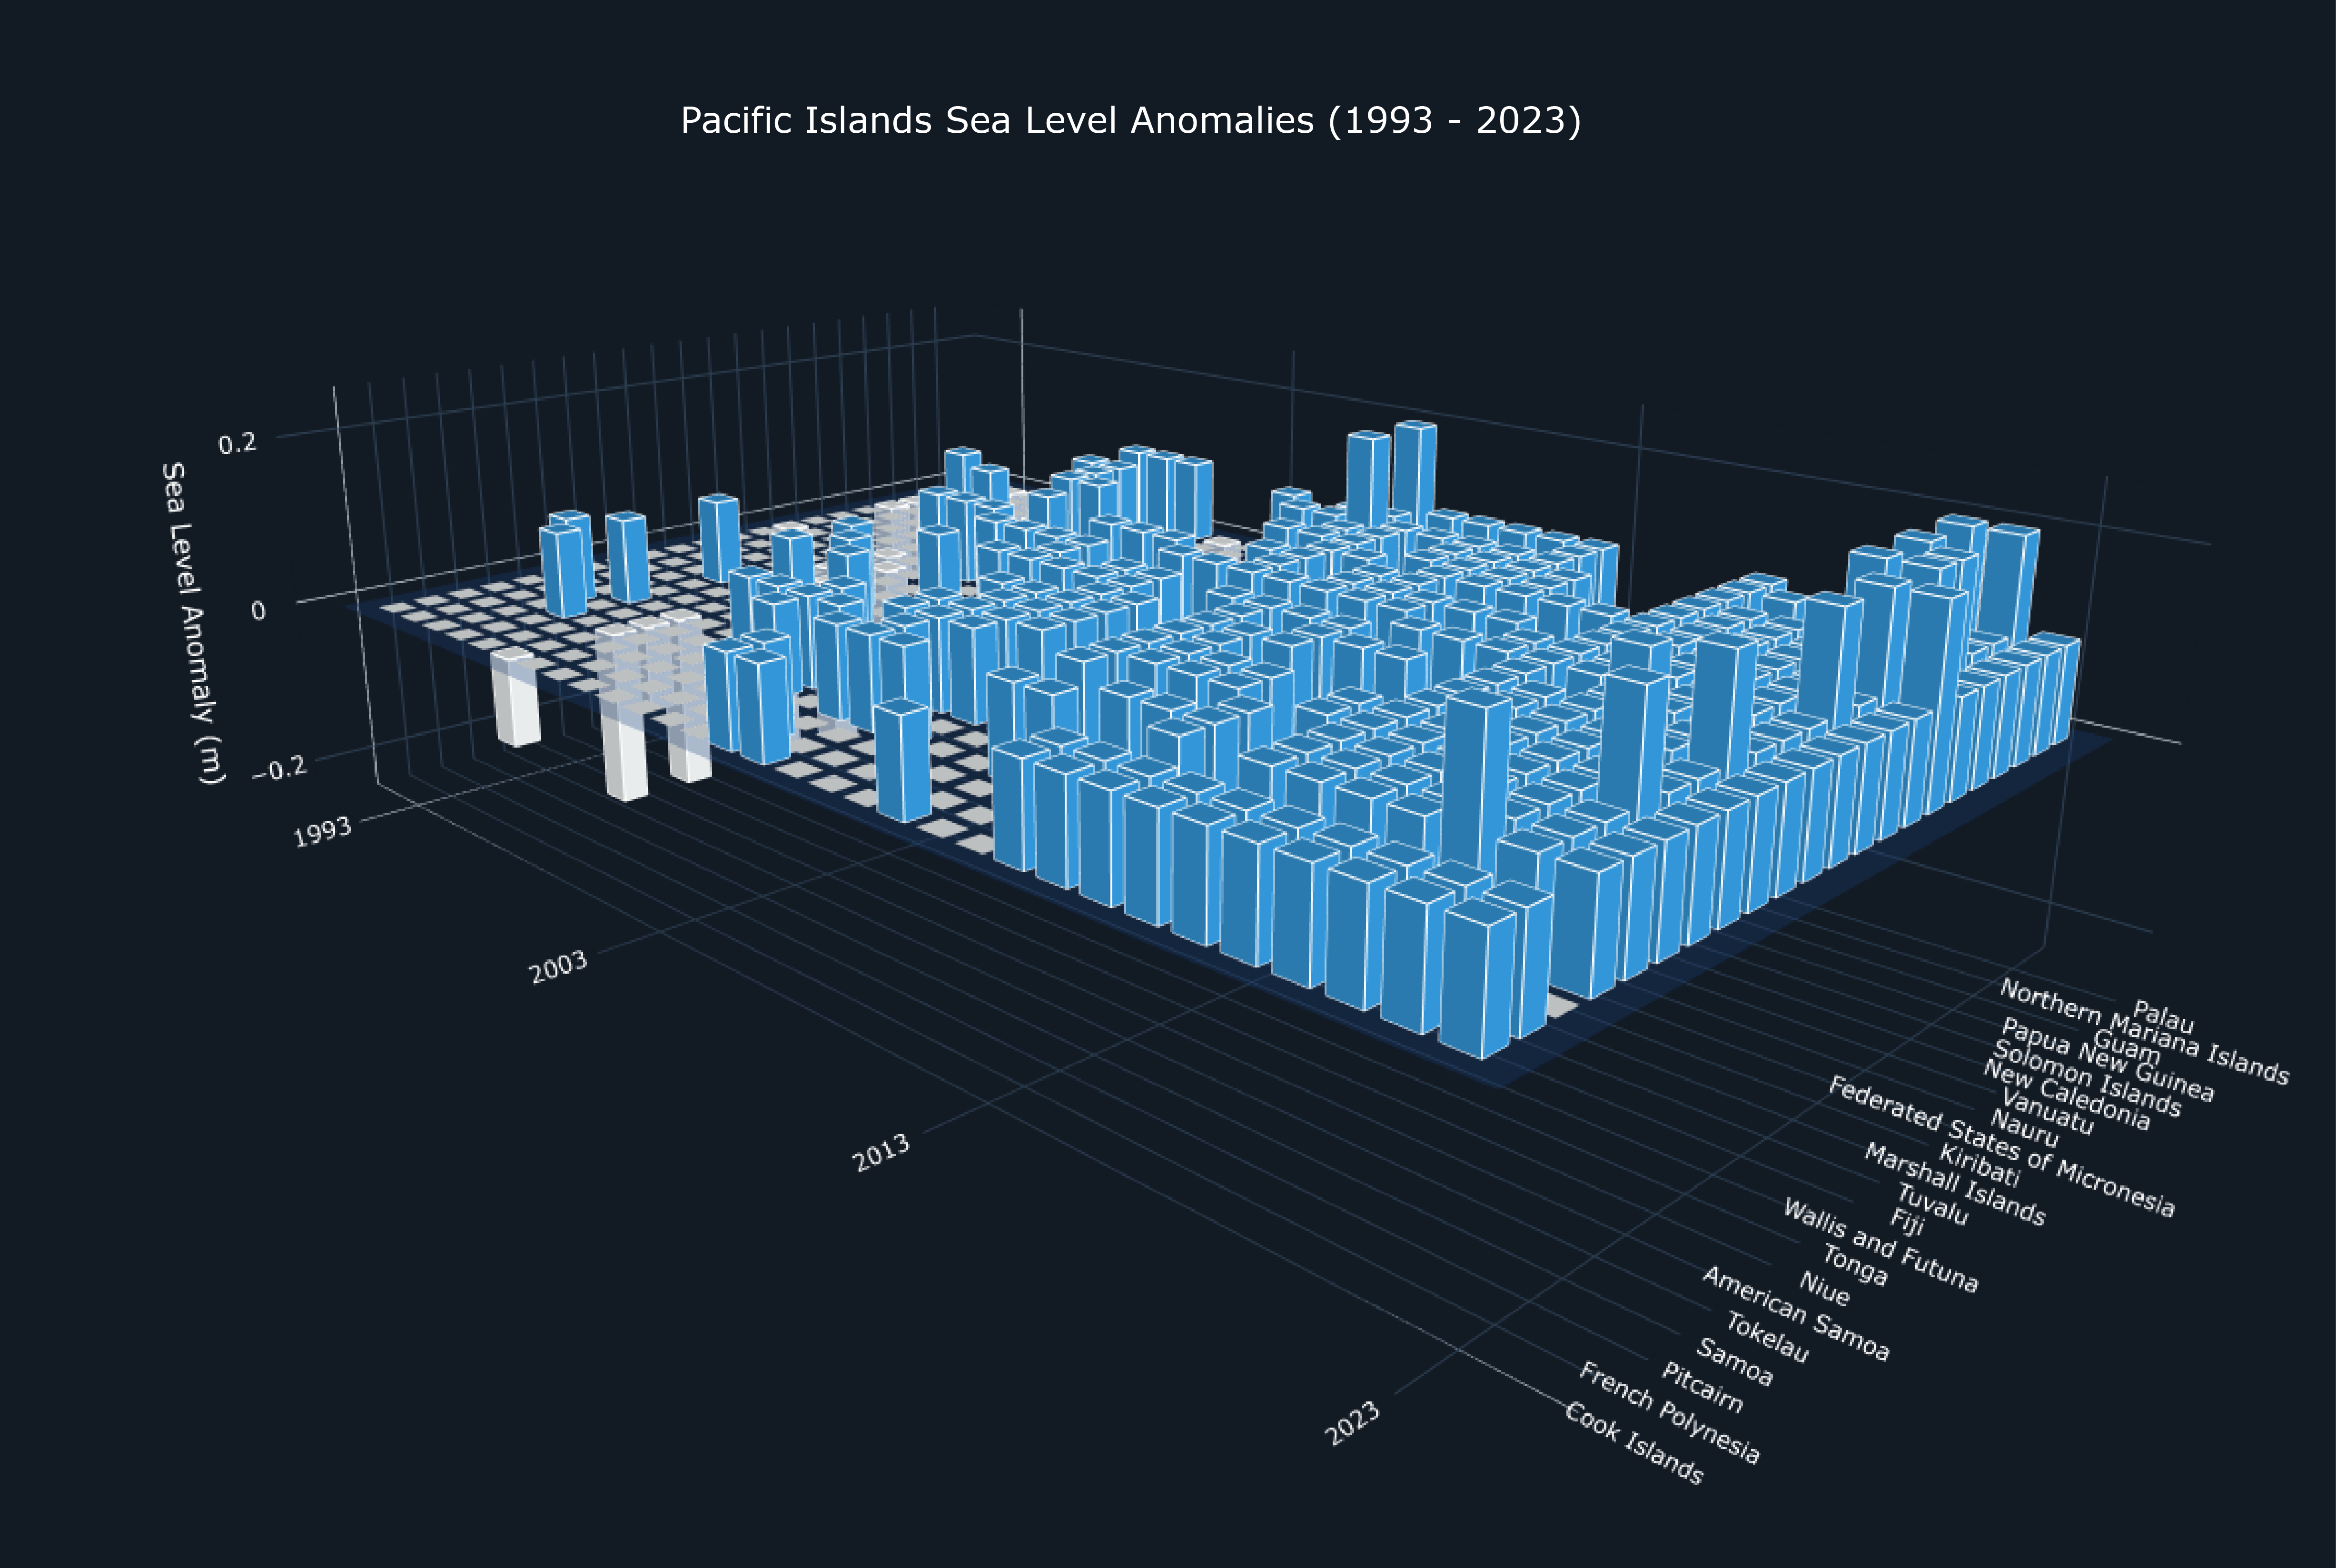
Furthermore, because rising sea temperatures directly cause sea levels to rise, primarily through thermal expansion, we must examine exactly how this process threatens these islands. While satellite data only tracks back to 1993, this 30-plus-year window offers a startling look at the rising waters. Let's examine how this process is threatening these vulnerable island states.

To measure this threat, we look at the Sea Level Anomalies (SLA) indicator, which monitors ocean heights from space. By comparing these satellite readings to a historical average from 1993 to 2012, we can calculate the exact difference, or "anomaly", in meters. In this visualization, blue bars represent a rising sea, and white bars show a drop. Notice how blue bars entirely dominate the most recent years. This undeniable upward trend poses a catastrophic risk to low-altitude nations such as the Marshall Islands, Kiribati, Tokelau, and Tuvalu.
Oceanic nations are incredibly diverse in terms of their status, population size, age demographics, and CO₂ emissions. They have followed different economic development paths based on their specificities, such as mineral resources, population growth and geographic constraints. These different paths are interestingly visible in the evolution of their CO₂ emissions, despite their globally insignificant contribution to emissions (less than 0.05%).
Yet, they are bound together by a shared existential threat: climate change. Rising temperatures and surging sea levels threaten to swallow entire islands, which could soon force massive populations to flee their homes. However, these nations possess a unifying trump card, their vast, globally significant Exclusive Economic Zones (EEZs).
They must join forces to safeguard their ocean from overexploitation, pollution, and unsustainable tourism. They must also turn this vast maritime footprint into political and economic leverage: the Blue Leverage. Survival demands total unity on the world stage. By standing together, these island states can compel global powers to fund urgent adaptation and negotiate dignified migration pathways , ensuring their rich cultural identities endure even if their physical land vanishes beneath the waves, regardless of their historical status.